


 Contact Us

NEW DATA THIS MONTH: Q1 Retail Sales Report
DATA
JUST RELEASED NEW FOR 2024
The Music Industry Census 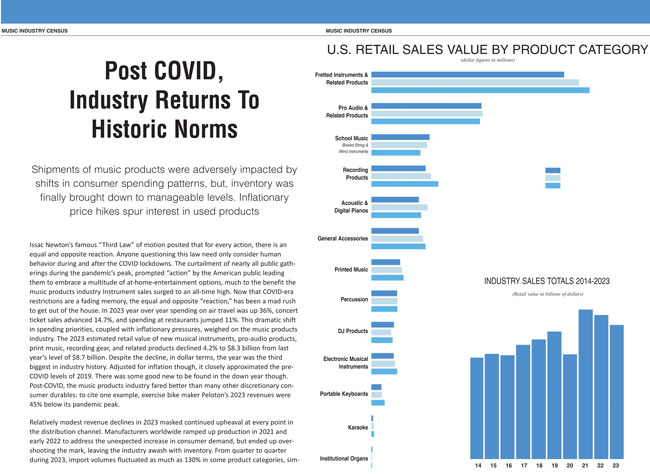
Find detailed sales statistics on all music and sound equipment: 55 different categories, average unit prices, sales by price point, unit volume, retail and wholesale margins, year-to-date, and 10-year historical data. From grand pianos to power amplifiers and synthesizers, if it has to do with the creation of sound, our research department has detailed sales information from the U.S. market.
Available formats:
PDF: $65
Microsoft Excel + PDF: $129.95 - Spreadsheets include 10 years of sales history with year over year comparisons, wholesale and retail value, unit sales, and average unit selling prices.
Order below or email: paul@musictrades.com
Music Trades' authoritative market data on sales of all musical instruments, sound and publishing products covers 55 distinct categories of products. Information is available for the following product groups:
| Acoustic Guitars Brass Instruments Cabled Microphones Cables CD Players Digital DJ Controllers Cymbals Digital Pianos Digital Tape Multi-Track Drum Heads Drum Kits Drum Machines Educational Percussion Electric Guitars Electronic Pianos Electronic Player Pianos Fretted Instrument Strings General Accessories Grand Pianos Hand Percussion Hard-Disk Multi-Track Individual Drums Hardware Institutional Organs Karaoke Machines Keyboard Synthesizers |
Keyboard Controllers Keyboard Synthesizers Multi-Effect Floor Processors Non-Powered Mixers Notation Software Plug In Software & Loops Portable Keyboards (Over $199) Portable Keyboards (Under $199) Power Amplifiers Powered Mixers Print Music Rack Mounted Samplers Rack-Mounted Processors Recording/Sequencing Software Rhythm Machines, Production Centers Sequencers Sound Cards, Computer Hardware Speaker Enclosures Special Effects Lighting Units Sticks & Mallets Stringed instruments Turntables Ukuleles Vertical Pianos Wireless Microphones Woodwind Instruments |
Below is a sample of data (not actual) presented in this annual report. Similar data is available for all categories.
| Total Guitar Sales | |||||
| Year | Units | % Change | $ Retail | % Change | Avg. Price |
| 2023 | 2,630,950 | 6.4% | $1,070,244,000 | 7.0% | $433 |
| 2022 | 2,472,700 | -.3% | $1,000,676,130 | 11.4% | $403 |
| 2021 | 2,489,390 | -.3% | $934,971,450 | 11.4% | $372 |
| 2020 | 2,496,185 | 5.0% | $839,000,000 | 2.2% | $353 |
| 2019 | 2,377,310 | 1.5% | $820,746,000 | 21.0% | $361 |
| 2018 | 2,341,551 | 20.5% | $903,261,000 | -1.9% | $386 |
| 2017 | 1,942,625 | 11.4% | $921,057,000 | .13% | $529 |
| 2016 | 1,742,498 | 5.6% | $922,280,000 | -0.1% | $529 |
| 2015 | 1,648,595 | 23.3% | $923,522,000 | 21.2% | $560 |


The leading SOURCE OF DATA & ANALYSIS SINCE 1890
© 2018 Music Trades Corporation. All Rights Reserved